A real-time COVID-19 statistics dashboard that fetches live global and country-wise case data and visualizes confirmed cases, recoveries, deaths, and vaccination rates using interactive Plotly charts. Features country comparison and a choropleth world map.
Tech Stack: Python, Flask, Plotly, Pandas, REST API, Data Visualization, Public Health, ChoroplethDownloads: 66
✏️
100%
Customizable — Make It Your Own
The report, PPT slides, and source code are fully editable. Change the title page,
add your college name, modify sections, rename variables, extend features — anything your college or
guide requires. No restrictions whatsoever. The pre-trained model
is bundled inside — no training from scratch required.
👀 See What's Inside
This is a live preview of the deliverables you will receive when purchasing any project on our platform.
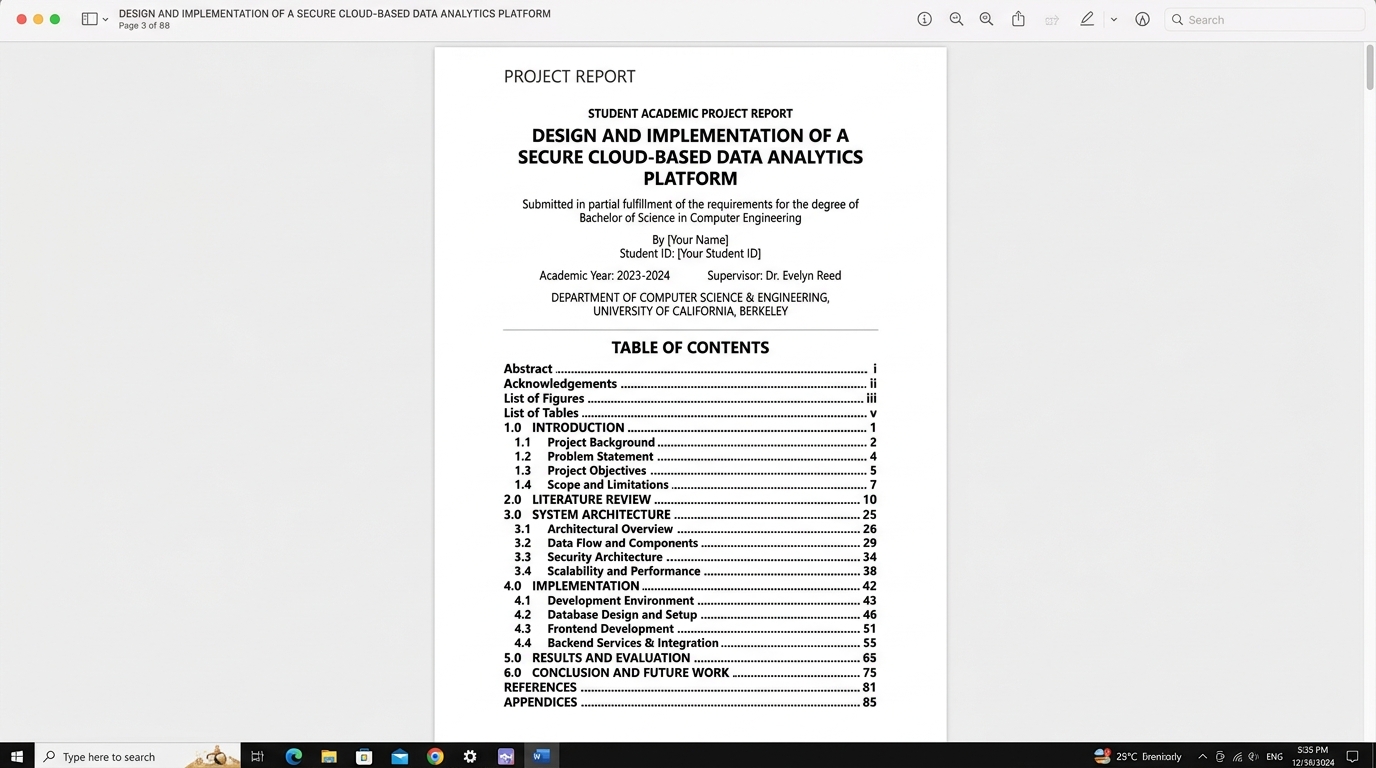
Academic Project Report
Professionally formatted in IEEE/University standard format. Approx 40 pages.
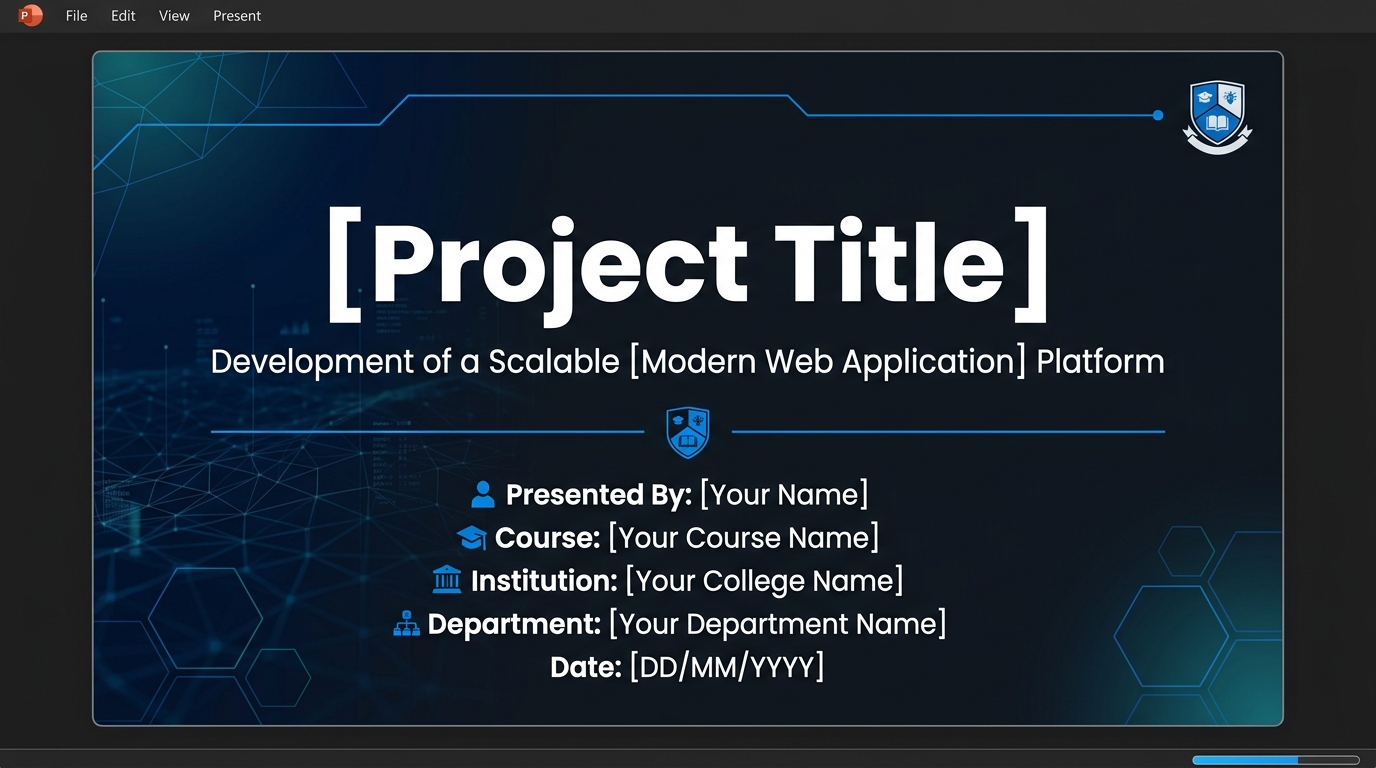
Presentation Slides
Clean, modern, and ready for your final year presentation. Approx 12 to 15 slides.
Internship Certificate
Official 4/8/12 week internship completion certificate.
Project Certificate
Unique QR-coded project completion certificate.
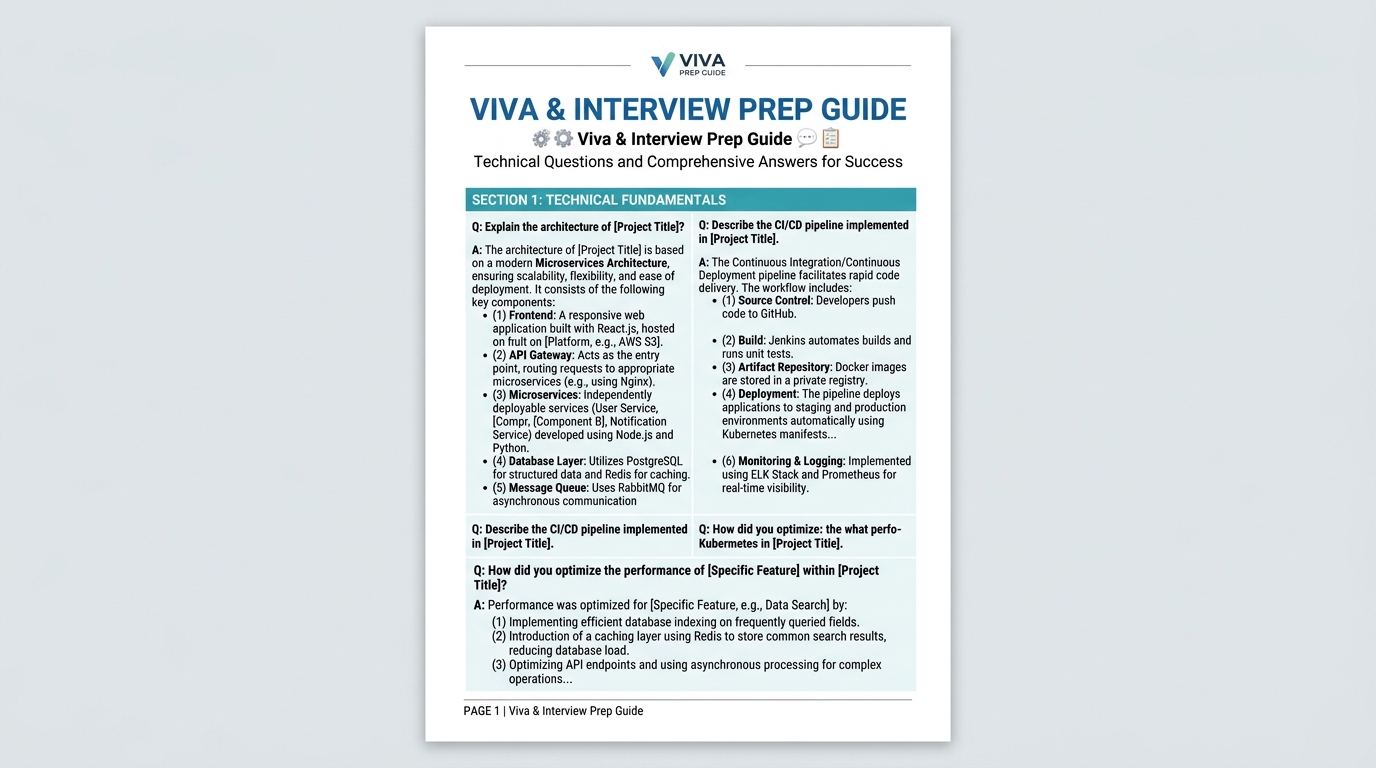
Viva Questions Prep
Detailed technical Viva Q&As with explanations.
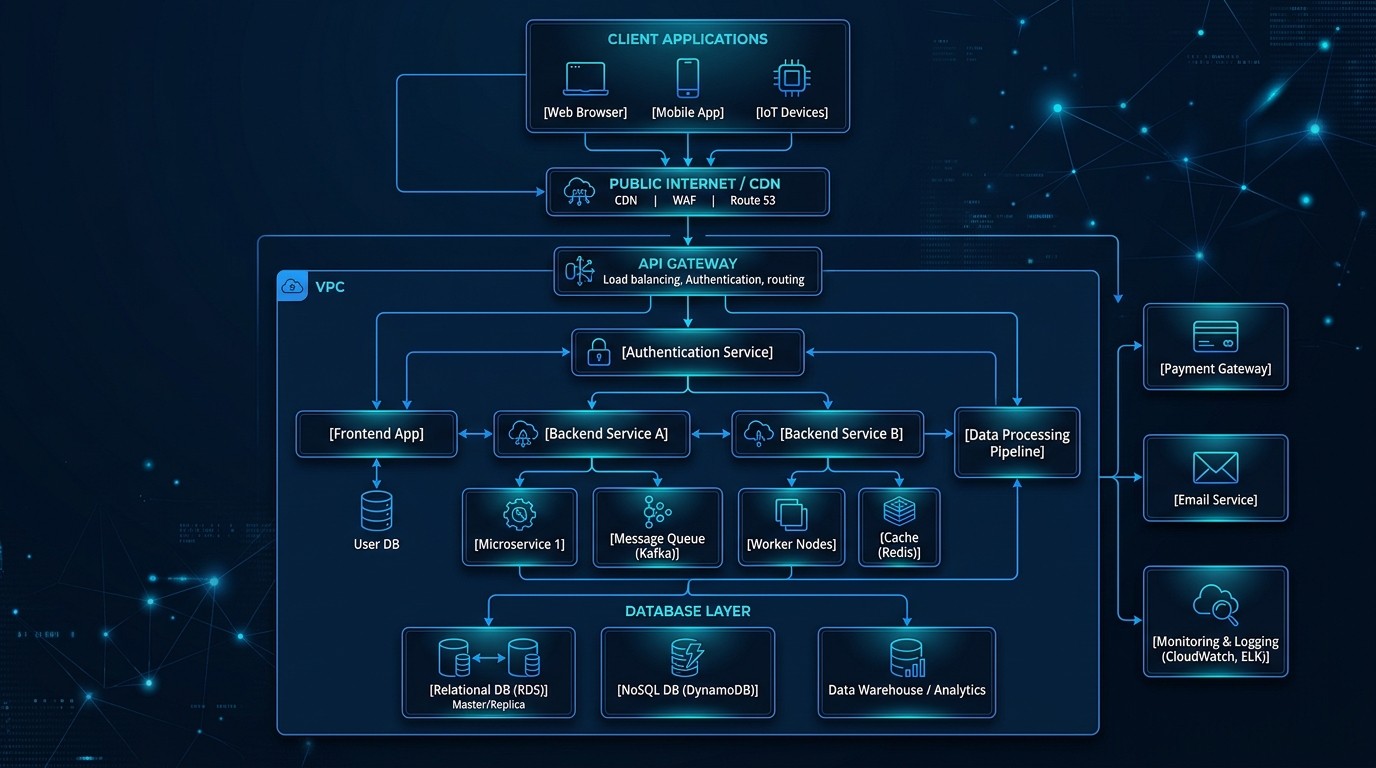
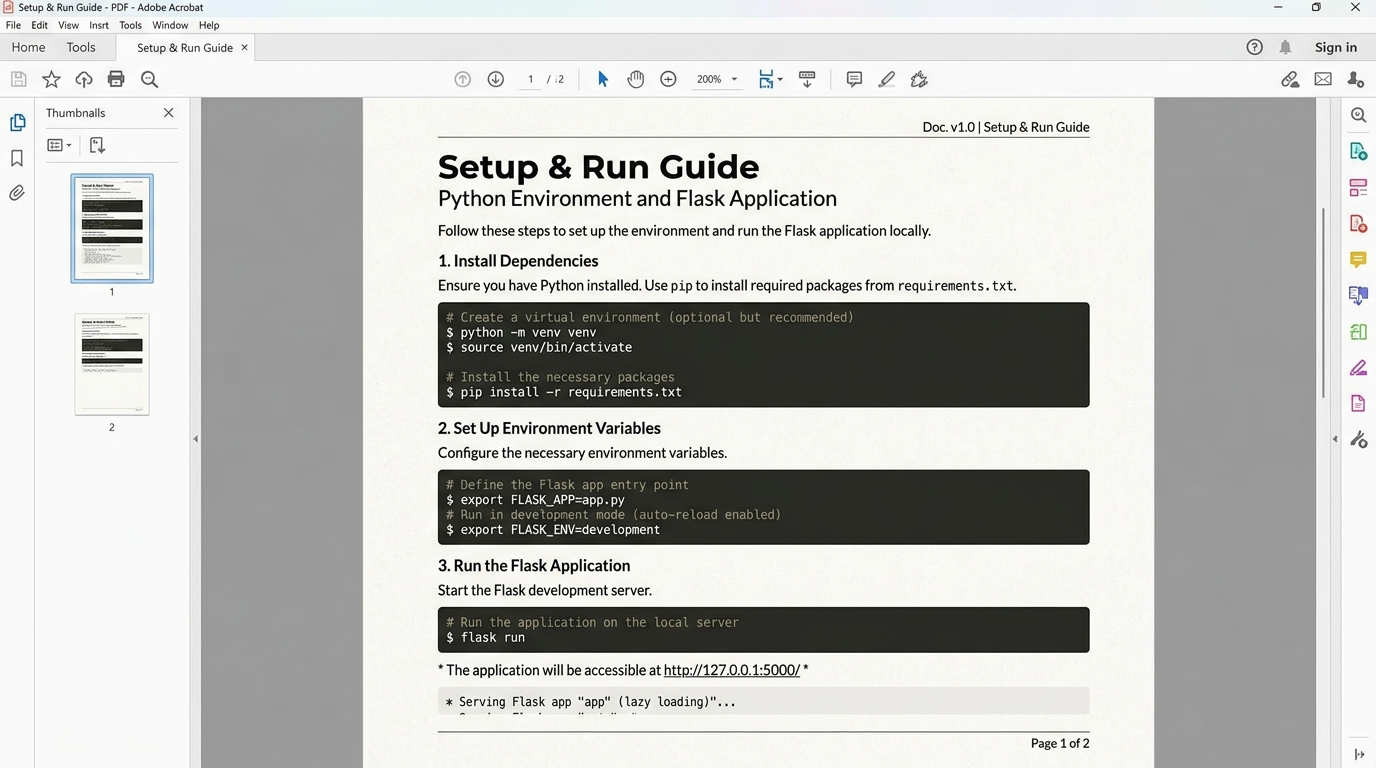
Architecture Diagram
System workflow flowchart & data processing pipeline specs.
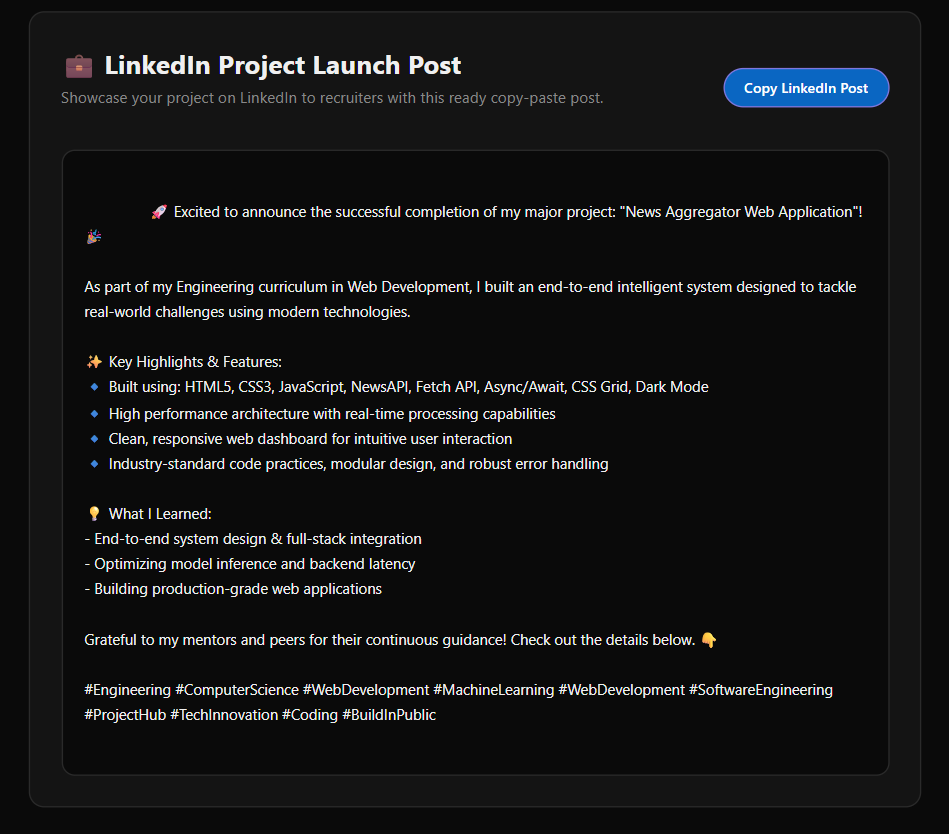
LinkedIn Post Draft
Ready-to-post LinkedIn content to showcase your project.
Prepare for your project viva with these likely questions and suggested answers.
1. What is the core objective of the COVID-19 Tracker Dashboard and what real-world problem does it solve?▼
2. Explain the system architecture and end-to-end data flow in COVID-19 Tracker Dashboard.▼
3. Why was Python, Flask, Plotly, Pandas, REST API, Data Visualization, Public Health, Choropleth selected for this project over alternative frameworks?▼
🔒
Viva
Questions Locked
Top interview and viva
questions unlock after purchase.
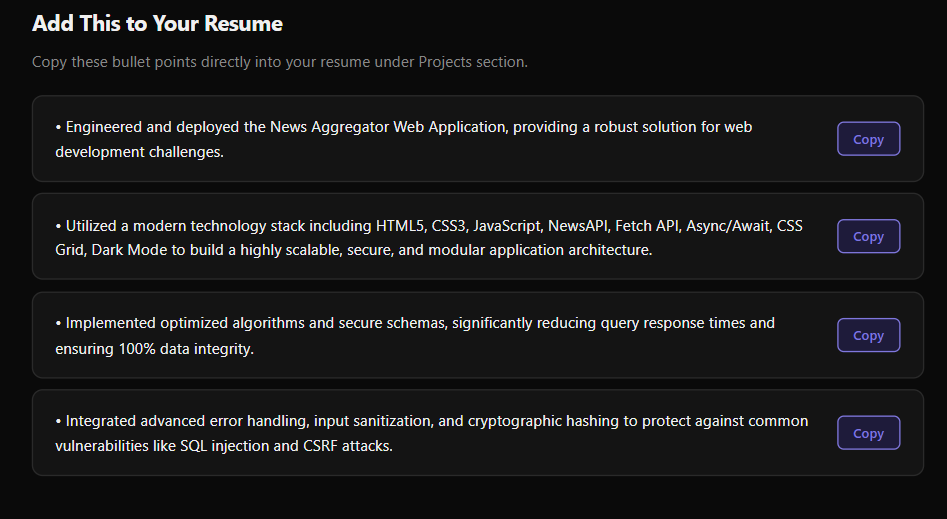
Copy-ready resume bullet points are included with this project.
• Engineered and deployed the COVID-19 Tracker Dashboard, providing a robust solution for data science challenges.
• Utilized a modern technology stack including Python, Flask, Plotly, Pandas, REST API, Data Visualization, Public Health, Choropleth to build a highly scalable, secure, and modular application architecture.
🔒
Resume
Points Locked
4 professionally written resume bullet points are included. Purchase
this project to unlock them.